|
Home
Up
Co-brand
Partnerships


| FREE
EMAIL |
|
| |
| MAILING
LIST |
| |
| NEWS
SEARCH |
|
| WEB
DIRECTORY |
|
| WEB SEARCH |
|
| CITY
GUIDES |
|
|
| WEATHER |
|
|
MASTERING
THE TRADE
ORIGINAL, INTERACTIVE
SEMINAR ON TRADING USING
TECHNICAL ANALYSIS
|
| |
| EARNINGS
ESTIMATES
|
|
|
| U.S.
QUOTES |
|
|
| U.S.
CHARTS |
|
|
| TECHNICAL
OPINION |
|
|
| CANADIAN
CHARTS |
|
|
|
SEC FILINGS
|
|
|
| BROKER
RESEARCH
|
|
|
| |
| 4/23/99 Adolph Coors (RKY)
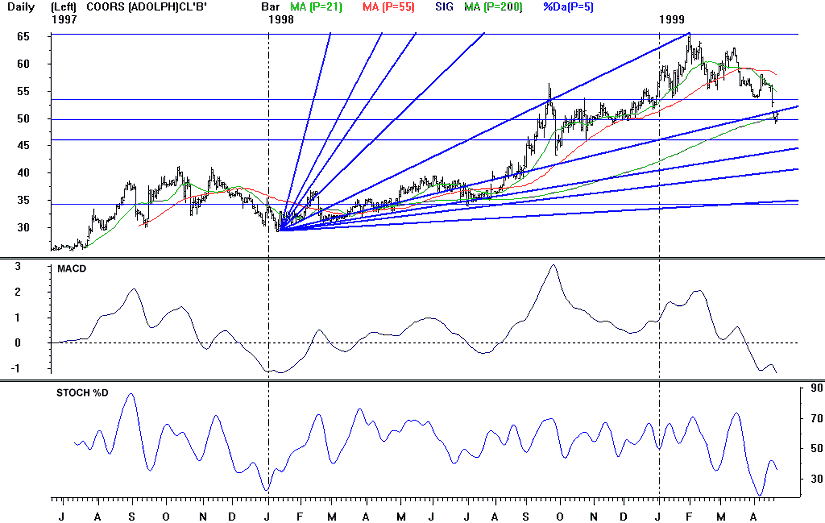
Points to watch: Since peaking in early
February RKY has been in a steep correction. Daily MACD gave a sell signal on 3/25.
The stock has fallen below both its 21 day (54.82) and 55 day (57.89) moving
averages and closed Thursday just above its 200 day moving average at 50.34. The
break below the 55 day M.A. on 3/18 was the first time Coors has fallen below the 55
day M.A. since it broke above it last August 7th. The stock is not at a critical
juncture. Coors gapped below Gann angle support at 51.43 this week. The 200
day moving average at 50.34 now provides important support. Additional strong
support exists at 50 (the 50% retracement of its July-February rally). A break below
this support would be a strong sell signal.
|

|
